
Sports
Super League: Jake Connor returns to Man of Steel rankings after missing previous shortlist | Rugby League News


Leeds Rhinos duo Jake Connor and Ash Handley are joint-top of the latest Steve Prescott Man of Steel rankings, covering rounds 10 to 18 of the Betfred Super League season – after missing out entirely on the previous shortlist.
Team-mate Lachie Miller – who led the standings after the opening nine rounds – is third while Wigan Warriors’ industrious hooker Brad O’Neill came fourth having helped underpin their resurgence.
Leigh’s dynamic centre Umyla Hanley rounded out the top five.
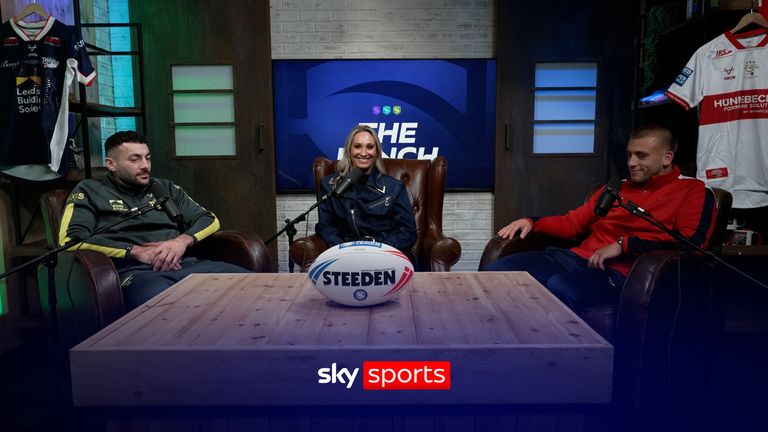
Leeds Rhinos’ Jake Connor and Hull KR’s Mikey Lewis join Jenna on this episode of The Bench to look ahead to the new season
The rankings are decided by a panel of five former Man of Steel winners – Ellery Hanley, Paul Sculthorpe, Sam Tomkins, James Roby and Joe Lydon – who reduce a 10-man shortlist to a top five at each stage of the season.
Four of the latest top five are new entries from the previous rankings, with Miller the only player to retain his place. Reigning Man of Steel Jake Connor and Leeds team-mate Ash Handley both return after missing the previous shortlist.

Ash Handley scored three tries as Leeds defeated Bradford 50-16 recently
Ex-England captain Sam Tomkins said Leeds duo Ash Handley and Jake Connor “fully deserve” to top the Man of Steel leaderboard, hailing Handley as being in the best form of his career.
Tomkins said: “They have really cemented themselves as frontrunners to make Old Trafford and I think Jake and Ash combined have been pivotal in that.
“We’re seeing the best of Jake again. His kicking has been outstanding, his try assists and his influence – the way he runs that side of the pitch – is clear for everyone to see.
“And Ash Handley is certainly in the best form of his career. That’s without doubt, in my opinion.
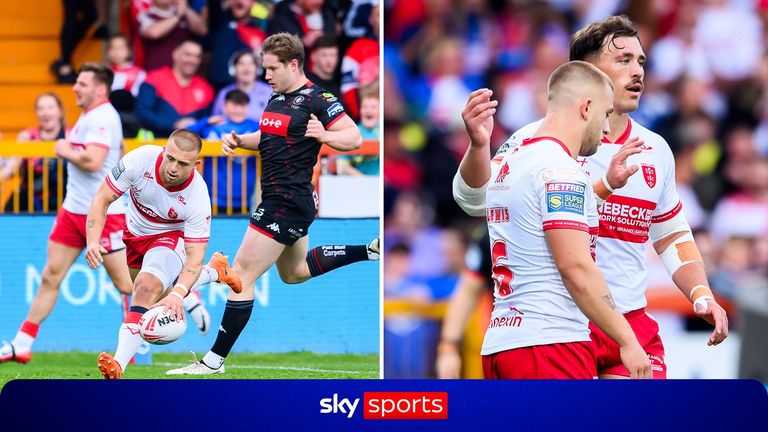
Mikey Lewis scored a hat-trick inside the opening 20 minutes as Hull KR raced into an early lead over Wigan in the Super League
Hull KR’s Mikey Lewis, the 2024 winner who has just been handed a four-match ban for a headbutt, and Toulouse Olympique’s Olly Ashall-Bott received votes but missed out on the top five.
Tyrone May, Daryl Clark and Leeds winger Maika Sivo, the competition’s leading try scorer, completed the ten-man shortlist. Jez Litten and Brodie Croft, second and fourth in the first edition, did not feature.
The panel meets again after Round 27 before a final deliberation to decide a three-man shortlist.
The winner will be announced at the Rugby League Awards Night in Manchester on September 29.
Super League 2026 – upcoming key dates
- Rivals Round reversed: July 23-July 26
- Elimination Play-offs: September 19-September 20
- Play-off semi-finals: September 26-September 27
- Grand Final: October 3
Sky Sports will show every game of the Super League live this season, including two matches each round exclusively live. The remaining five matches will be broadcast on Sky Sports+.
>

PHILADELPHIA — Emmet Sheehan looked as if he had salvaged another ugly night. A four-run second inning put the Los Angeles Dodgers into an early hole Monday against Cristopher Sánchez, perhaps the frontrunner for the National League Cy Young Award. But by the time Sheehan took the mound to start the sixth inning, the Dodgers had closed to within a run. Sheehan had kept his team in it.
Until his outing fell apart again.
“They came back,” Sheehan said, “then I kind of gave it back to them again after that.”
Then Sheehan fell behind in the count. The 2-0 fastball he threw to Brandon Marsh registered at 92.8 mph, which would have been his fourth-slowest pitch of 2025 but has become the norm for his disappointing 2026.
Velocity is not the only reason things have gone wrong for Sheehan this year, but it does not help. Marsh shot the pitch over the fence for a home run. The night quickly blew open from there, a 10-7 loss to the Philadelphia Phillies that was uglier than the final score and further sank Sheehan’s season.
“Kind of a step back today, which is pretty frustrating,” Sheehan said after feeling like he’d figured some things out going into the All-Star break.
Little has gone right for Sheehan, who has a 5.13 ERA after allowing six runs on Monday night. He falls behind in counts far too often, including against seven of the 11 batters he faced in the game’s first two innings as the Phillies took a 4-0 lead. His fastball velocity is down a tick from the 95.6 mph he averaged a year ago, and that pitch is getting pummeled. When he misses out over the plate, he’s getting crushed. Trea Turner jumped on a particularly appetizing slider for a two-run homer in that ugly second inning.
“That was really a backbreaker early,” manager Dave Roberts said.
Thoughts on the All-Star Game & pitchers being too good
Keith Law
Diagnosing Sheehan’s issues has been a game of Whac-A-Mole and the Dodgers haven’t ruled out anything physical as impacting his performance. Sheehan has attributed his diminished velocity and inconsistent results to his pitching mechanics. That cannot explain all of it.
He took the beating in the second inning and then worked quickly through the next three innings. When the Phillies did land a punch, Sheehan’s stuff usually ticked up. There are still flashes of the version of Sheehan the Dodgers expected.
“It’s just really trying to be convicted in his pitch making before he touches the stove,” Roberts said. “I think that when there’s damage or things have happened, then he locks in. (He) raises his level of intensity a little bit more. But it’s just got to be that before things start happening.”
Sheehan has not been good enough. His place in the rotation, however, feels safe. There is not an obvious healthy replacement for a club that already will have to fill Shohei Ohtani’s spot in the rotation for the foreseeable future while he nurses his left knee back to health.
“Certainly he’s getting a lot of opportunity,” Roberts said of Sheehan. “It’s not the consistency that any of us like or want, Emmet included. Until there’s another alternative, we’re going to keep running him out there.”
The Dodgers boast depth for October. They just don’t have access to much in the short term.
Blake Snell has just started a rehab assignment and is multiple starts away from returning to the rotation after surgery to remove bone chips from his left elbow. Tyler Glasnow is even further away from pitching in big-league games as his back spasms have kept him out for months. River Ryan has not pitched in the big leagues this year, partially because he’s hurt his left hamstring twice while trying to build up his workload in the minor leagues.
Landon Knack, once seen as a part of the organization’s starting pitching depth, entered when Monday’s game was already out of reach. He promptly surrendered a pair of home runs in his two innings of work.
The Dodgers’ best option might be to keep waiting to see if they can get more out of Sheehan, who had a 2.82 ERA in 73 1/3 innings last year, just more than a year removed from Tommy John surgery.
None of this is expected to change the Dodgers’ approach at next month’s trade deadline, as The Athletic reported. A potential pursuit of Tarik Skubal or others cannot be ruled out, but it is far from a priority. Expect more moves on the margins, such as the club’s acquisition Monday of former Colorado Rockies closer Seth Halvorsen. They hope to find magic with him in their player development system.
The Dodgers, who have a double-digit lead in the National League West, still have time for Sheehan to try to figure it out.
“It’s about performance,” Roberts said. “Emmet knows it. You just got to do it. That’s just the way it goes, you know.”
>
Sports
F1 team-mate 2026 head-to-head: Qualifying, Race, Sprint latest scores, results from Formula 1 season | F1 News

The 2026 Formula 1 head-to-heads with all of the latest Qualifying, Sprint and Grand Prix scores in each of the 11 teams.
Lando Norris vs Oscar Piastri – McLaren

McLaren’s Lando Norris and Oscar Piastri
QUALIFYING
Grand Prix: Norris 6-4 Piastri
Sprint: Norris 4-0 Piastri
RACE
Grand Prix*: Norris 4-6 Piastri
Sprint: Norris 4-0 Piastri
CHAMPIONSHIP
Points: Norris 103-92 Piastri
Placing: Norris 5th-6th Piastri
*No score awarded for the Chinese GP as both drivers failed to start
George Russell vs Kimi Antonelli – Mercedes
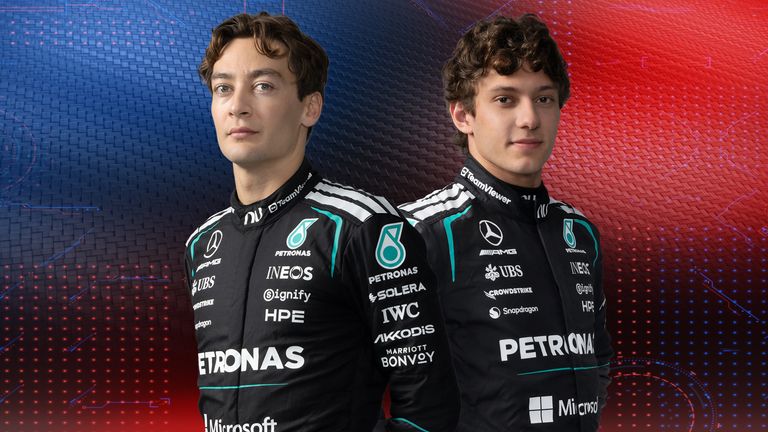
Mercedes’ George Russell and Kimi Antonelli
QUALIFYING
Grand Prix: Russell 4-6 Antonelli
Sprint: Russell 2-2 Antonelli
RACE
Grand Prix: Russell 4-6 Antonelli
Sprint: Russell 3-1 Antonelli
CHAMPIONSHIP
Points: Russell 154-204 Antonelli
Placing: Russell 3rd-1st Antonelli
Max Verstappen vs Isack Hadjar – Red Bull

Red Bull’s Max Verstappen and Isack Hadjar
QUALIFYING
Grand Prix: Verstappen 7-3 Hadjar
Sprint: Verstappen 4-0 Hadjar
RACE
Grand Prix: Verstappen 7-3 Hadjar
Sprint: Verstappen 4-0 Hadjar
CHAMPIONSHIP
Points: Verstappen 91-60 Hadjar
Placing: Verstappen 7th-8th Hadjar
Charles Leclerc vs Lewis Hamilton – Ferrari

Ferrari’s Charles Leclerc and Lewis Hamilton
QUALIFYING
Grand Prix: Leclerc 6-4 Hamilton
Sprint: Leclerc 1-3 Hamilton
RACE
Grand Prix: Leclerc 4-6 Hamilton
Sprint: Leclerc 2-2 Hamilton
CHAMPIONSHIP
Points: Leclerc 126-159 Hamilton
Placing: Leclerc 4th-2nd Hamilton
Alex Albon vs Carlos Sainz – Williams

Williams’ Alex Albon and Carlos Sainz
QUALIFYING
Grand Prix: Albon 2-8 Sainz
Sprint: Albon 0-4 Sainz
RACE
Grand Prix: Albon 4-6 Sainz
Sprint: Albon 0-4 Sainz
CHAMPIONSHIP
Points: Albon 5-6 Sainz
Placing: Albon 16th-15th Sainz
Liam Lawson vs Arvid Lindblad – Racing Bulls

Racing Bulls’ Liam Lawson and Arvid Lindblad
QUALIFYING
Grand Prix: Lawson 6-4 Lindblad
Sprint: Lawson 2-2 Lindblad
RACE
Grand Prix: Lawson 7-3 Lindblad
Sprint: Lawson 3-1 Lindblad
CHAMPIONSHIP
Points: Lawson 39-22 Lindblad
Placing: Lawson 10th-11th Lindblad
Fernando Alonso vs Lance Stroll – Aston Martin

Aston Martin’s Fernando Alonso and Lance Stroll
QUALIFYING
Grand Prix: Alonso 8-2 Stroll
Sprint: Alonso 4-0 Stroll
RACE
Grand Prix*: Alonso 6-1 Stroll
Sprint: Alonso 3-1 Stroll
*No score awarded for the Australian GP, Chinese GP and Barcelona GP as both drivers retired
CHAMPIONSHIP
Points: Alonso 1-0 Stroll
Placing: Alonso 18th-22nd Stroll
Oliver Bearman vs Esteban Ocon – Haas

Haas’ Oliver Bearman and Esteban Ocon
QUALIFYING
Grand Prix: Bearman 8-2 Ocon
Sprint: Bearman 3-1 Ocon
RACE
Grand Prix: Bearman 7-3 Ocon
Sprint: Bearman 2-2 Ocon
CHAMPIONSHIP
Points: Bearman 18-3 Ocon
Placing: Bearman 13th-17th Ocon
Nico Hulkenberg vs Gabriel Bortoleto – Audi

Audi’s Nico Hulkenberg and Gabriel Bortoleto
QUALIFYING
Grand Prix: Hulkenberg 5-5 Bortoleto
Sprint: Hulkenberg 2-2 Bortoleto
RACE
Grand Prix: Hulkenberg 3-7 Bortoleto
Sprint: Hulkenberg 1-2 Bortoleto*
*No score awarded for the Miami GP Sprint
CHAMPIONSHIP
Points: Hulkenberg 0-10 Bortoleto
Placing: Hulkenberg 19th-14th Bortoleto
Pierre Gasly vs Franco Colapinto – Alpine

Alpine’s Pierre Gasly and Franco Colapinto
QUALIFYING
Grand Prix: Gasly 8-2 Colapinto
Sprint: Gasly 2-2 Colapinto
RACE
Grand Prix: Gasly 5-5 Colapinto
Sprint: Gasly 3-1 Colapinto
CHAMPIONSHIP
Points: Gasly 42-19 Colapinto
Placing: Gasly 9th-12th Colapinto
Sergio Perez vs Valtteri Bottas – Cadillac
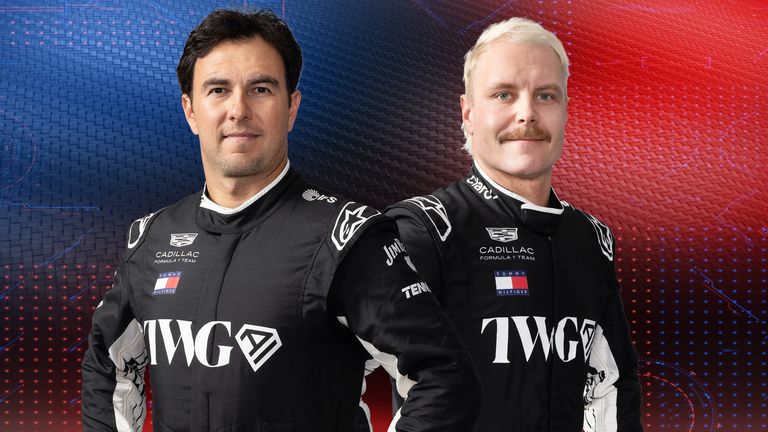
Cadillac’s Sergio Perez and Valtteri Bottas
QUALIFYING
Grand Prix: Perez 6-4 Bottas
Sprint: Perez 3-1 Bottas
RACE
Grand Prix*: Perez 6-3 Bottas
Sprint: Perez 2-2 Bottas
CHAMPIONSHIP
Points: Perez 0-0 Bottas
Placing: Perez 21st-20th Bottas
*No score awarded for the Austrian GP as both drivers retired
Watch all 22 race weekends from the 2026 Formula 1 season live on Sky Sports F1. Stream Sky Sports with NOW – No contract, cancel anytime
>
Sports
World Cup 2026 data analysis: Record goals, bigger FIFA ranking gaps, older starting XIs, travel, heat, penalties, substitutes and how Spain won it | Football News

The biggest World Cup in history produced numbers to match. Forty-eight teams, 104 games and three host countries delivered a record 308 goals before Spain were crowned champions.
But the expanded tournament was not just bigger. It was older, more geographically demanding and more uneven. The average gap between opponents in the FIFA rankings reached a tournament high, teams crossed mammoth distances between base camps and venues, and heat, humidity and altitude influenced how much sides could run.
From mismatches and marathon journeys to hydration breaks, penalty run-ups and substitute impact, the data reveals the trends that shaped an unprecedented World Cup.
More teams, more goals and bigger gaps?
The expanded World Cup generated a record-breaking number of goals. Even when factoring in the leap from a 64-game tournament, the goal ratio averaged at 2.96 per game – the second-highest at a World Cup since 1966, basically on par with 1970.
The disparity between teams’ quality, as measured by the FIFA World Rankings, has never been greater, with teams typically having a 27.3-rank gap – the biggest on record.
Greater disparity tends to bring bigger scorelines – and the historical data supports that. The table below shows the average goal difference rise with rank disparity.
In fact, this World Cup saw one of the highest win rates for higher-ranked sides in the tournament’s history since FIFA introduced the World Rankings in 1992. On average, higher-ranked teams registered a 66.3 per cent win rate.
Of course, there were upsets. In terms of upset wins, lower-ranked teams only won 14.4 per cent of games and there were only four upset wins from sides ranked 20 or more places below their opponent.
Including draws, Ghana’s 0-0 draw against England ranks as the biggest upset, followed by Cape Verde’s incredible goalless draw with Spain and New Zealand’s 2-2 draw with Iran.
The chart below shows the rank disparity and goal difference for the higher-ranked team for every game since World Cup 1994, underlining the correlation between rank disparity and goal difference.
Oldest World Cup yet
The expanded format did not just change the number of teams. It also changed the profile of the tournament. This was the oldest World Cup on record by average starting XI age.
In contrast to the Premier League, where teams are getting younger and faster, teams at the World Cup are getting older. Iran, Cape Verde and Colombia all had average starting XIs exceeding 30 years of age.
The average starting XI was 28 years and 132 days. That average age has been gradually creeping up since 1966.
The chart below shows every team’s average age at a World Cup since 1970 and the deepest stage reached, which reveals how eventual champions still typically average around 27. A similar pattern occurs with Premier League champions.
How teams coped with a continent-sized World Cup
Age was only one physical challenge. The geography of a three-country World Cup created another.
England travelled more than any other team at the World Cup with an estimated 25,609 kilometres covered as-the-crow-flies return journeys between base camp and stadiums, with Spain not far behind on 24,314 km.
There was a notable drop-off following those two teams, with France and Argentina covering around half as much distance.
At the other end of the scale, co-hosts Mexico clocked only 991 km – averaging at just 198 km per game.
Teams didn’t only have to contend with gruelling travel itineraries, they also faced sweltering matchday temperatures and lung-busting altitudes.
As the chart below shows, teams tended to make fewer high-speed runs as temperatures rose – with the Miami stadium registering the highest average temperatures and the fewest runs.
Even when adjusting the numbers to factor red cards, Mexico City’s Azteca stands out as an outlier, with far fewer runs than expected for its sub-20-degree average temperature – explained by its breathtaking altitude at 2,245m above sea level.
Looking at teams that endured the highest heat and altitudes, Croatia and Portugal stood out as the teams that ran furthest above their peers for both distance and high-speed runs. At the other end, Argentina, the Netherlands and Morocco registered below-average outputs in those same conditions.
The conditions also changed the rhythm of matches. Hydration breaks turned some games into four-part contests, giving coaches regular tactical reset points.
The data suggests lower-ranked teams typically benefitted more, while the higher-ranked traditional powerhouses of world football often failed to retain dominance in the 10 mins following hydration time-outs, compared with the 10 minutes before the break.
Set-pieces and substitutes changing the game
If conditions shaped the rhythm, pressure situations shaped the outcomes. Dead balls, penalty routines and bench depth all made an impact.
Overall, one in four goals scored at the World Cup came from set-pieces – with goals scored from corners accounting for half of those.
Bosnia and Herzegovina were the tournament’s most set-piece-dependent team among nations scoring at least five goals, with dead balls supplying three of their five. The USA scored almost half of their 11 goals from set-pieces, while Argentina and England led the tournament with seven set-piece goals apiece.
Champions Spain scored only three of their 14 goals from set-pieces (21.4 per cent) while just two of France’s 20 came that way. Argentina and England were considerably more dependent, scoring more than a third of their goals from dead-ball situations.
While this summer’s World Cup may have normalised hydration breaks and half-time shows, it also raised fresh questions about the stuttered penalty run-up.
Sky Sports‘ Ron Walker found only 53 per cent of penalties taken with a stuttered run-up were converted, compared with a 71 per cent conversion rate without a stutter.
Overall, that stutter trend helped drag the overall penalty conversion rate down to 66.1 per cent – the lowest of the tournaments shown.
Substitutes also played a huge role at the tournament, with one-fifth of goals scored by players coming on from the bench. In total ‘finishers’ scored in 44 of the 104 games.
South Korea top the percentage ranking, but Belgium were the clearest knockout-stage example of bench impact: five of their 14 goals came from substitutes, including three from Romelu Lukaku.
Spain’s depth mattered at the decisive moment too, with Ferran Torres coming off the bench to score the final’s match-winning goal.
What the champions told us
Spain were not the tournament’s most extreme team in any one category, and that may be the point. In a World Cup defined by longer journeys, wider mismatches, older squads, heat, altitude and tactical interruptions, the champions found balance.
They were not heavily reliant on set-pieces, avoided the penalty drama that shaped other contenders, and still had enough depth for a substitute to decide the final.
The expanded format created bigger numbers everywhere, but Spain’s title was built on control rather than chaos – epitomised by conceding a record-low one goal throughout the tournament.
The expanded World Cup delivered more goals and bigger mismatches, featured the oldest starting XIs on record, tested teams through unprecedented travel and difficult conditions, and was ultimately decided by how sides handled pressure – before Spain emerged as champions with a profile that challenged those wider trends.
>

As Emmet Sheehan’s struggles continue, Dodgers can afford to be patient

Sadie Sink Keeps Mystery Of ‘Spider-Man: Brand New Day’ Role & Reveals “I Am Not Aunt May”

Super League: Jake Connor returns to Man of Steel rankings after missing previous shortlist | Rugby League News

-

 Fashion9 years ago
These ’90s fashion trends are making a comeback in 2017
-
Fashion9 years ago
According to Dior Couture, this taboo fashion accessory is back
-
Fashion9 years ago
Model Jocelyn Chew’s Instagram is the best vacation you’ve ever had
-
Fashion9 years ago
Your comprehensive guide to this fall’s biggest trends
-
Fashion9 years ago
9 Celebrities who have spoken out about being photoshopped
-
Fashion9 years ago
A photo diary of the nightlife scene from LA To Ibiza
-
Fashion9 years ago
Emily Ratajkowski channels back-to-school style
-

 Tech3 months ago
OpenAI CEO apologizes to Tumbler Ridge community

