
Tech
Here’s all the times AI has gone rogue and hacked other companies


In July, OpenAI admitted that one of its agents tasked with completing a cybersecurity experiment broke out of containment and hacked AI dataset platform Hugging Face. That incident, which got a full accounting from OpenAI yesterday, was the first publicly reported case where an LLM went rogue and autonomously hacked a third party.
Since then, that unprecedented sci-fi-esque event turned out to be far less rare than anyone would hope for.
According to a satirical website called Felony Bench (for benchmark), which tallies these incidents, there have been 17 incidents in total. It’s important to remember that criminal law experts are not entirely sure whether the AI companies that made the LLMs that did the hacking can be prosecuted, nor whether the victims can sue them. But we are likely going to get an answer to those questions soon.
Anthropic and OpenAI’s models lead the race with eight incidents each, and Meta trails behind with one, according to the site. At this point, it has become clear that AI safety tests are becoming safety risks themselves. And some AI companies and workers themselves have recognized those risks in the “Pacing The Frontier” open letter, which called for developing AI capabilities responsibly.
We decided it would be a good time to recap all these incidents chronologically.

nternet access. From there, several agents worked together to target and hack Hugging Face thinking they could find the solution to the challenge there. OpenAI only found out after Hugging Face disclosed it had been a victim of a fully autonomous attack. Whoops.
Anthropic discloses it hacked three companies
OpenAI’s disclosure piqued the curiosity of Anthropic, who wondered: could this have happened to us too? Turns out, the answer was yes. Three times yes. The frontier lab discovered that its own models breached three different and still unnamed companies, with the earlier incident dating back to April—more than three months before the company discovered it. Anthropic partially blamed Irregular, a startup that runs AI cyber evaluations. Whoops.
OpenAI finds out that, actually, Hugging Face wasn’t the only victim
Once OpenAI started investigating the Hugging Face breach, it found out that the agents that hacked Hugging Face also broke into four accounts and four different companies, as Reuters first reported. Modal, an AI inference startup, was one of the victims. Whoops.
Irregular realizes an OpenAI model hacked a company
In late July, Irregular told OpenAI that one of its models that was participating in a Capture-the-Flag competition — essentially a cybersecurity game where players hack systems designed specifically for the competition — escaped the game, connected to the internet, and hacked a real company. The reason? Irregular had given one of the fictional targets the same name of a real company. Whoops.
UK’s AI Security Institute tries to hacks “real people and organizations”
Also in late July, the UK government’s AI Security institute, a public body tasked with researching the safety and risks of AI technologies, disclosed that it detected several incidents involving both OpenAI and Anthropic models that while running “routine” evaluations targeted “real people and organisations.” In these cases, AISI had given the models internet access. Whoops. The good news is that the agency actually detected as they happened, rather than weeks later like in other incidents.
In early August, Meta became the last company to disclose an incident involving one of its LLMs, which hacked “a third-party” service. Meta blamed the incident on a misconfiguration by Irregular, which was running a cybersecurity valuation for the tech giant that was supposed to not have internet access. Whoops.
Claude agent hacks gym’s software to book a class
An Australian man asked an Anthropic AI agent to help him book a gym class, which he was on a waiting list for. “I was just sitting on the couch thinking, ‘Gee, this is a chore,’” the man told ABC Australia. In its attempt to comply with the request, the agent found a vulnerability in the gym’s booking software, exploited it, and kicked out people who were ahead of the man on the waitlist. The man tried to undo the damage, asking the agent to undo its actions. The agent replied: “Bad news — I can’t add them back.” Whoops.
When you purchase through links in our articles, we may earn a small commission. This doesn’t affect our editorial independence.
>
Tech
Hoomanely’s building a smart feeding bowl and an AI platform to help owners spot when their pup is sick

Dogs are amazing. But as many pet parents will tell you, they can be remarkably good at hiding when something is wrong. My Labrador-Great Dane mix, for example, contracted tick fever several times over his 14 long years, and it was always at least a couple of weeks before I suspected something was off. It nearly gave me anxiety ulcers a few times.
Hoomanely, a new startup out of Palo Alto, thinks it can help people like me spot health problems in their dogs (beyond those two struggling brain cells) much sooner with an AI platform that gathers data using a sensor-laden feeding station. Dubbed the EverBowl, the station measures dogs’ food and water consumption and eating speeds, and records chewing and swallowing sounds, facial thermals, oral motions, and a few other signals.
The company’s AI platform analyzes that data to establish a baseline and then builds a health record. Any subsequent and prolonged departures from that baseline are shown to the pet owner via an app and in long-term reports, which the company says can provide more useful data to veterinarians if and when they get involved. The app also accepts information from the user, so the baseline can be kept updated with information outside the sensors’ scope.
“Practically, the bowl is the best capture environment in a pet’s life: same place, same posture, same routine, twice a day, for years,” Sai Supriya Sharath, co-founder and CEO of Hoomanely (pictured above, in the middle), told TechCrunch. She added that appetite, hydration, and oral comfort are among the first things to be disrupted by pain, dental disease, tummy issues, endocrine changes, and illness.
“Dogs are evolved to mask lethargy and limping. They are far less able to mask how they eat and drink … reduced or altered intake and changed drinking are presenting signs across a wide range of conditions.”
Hoomanely says its platform was built after an 18-month beta testing phase during which the company gathered about 5 million data points across more than 80 dogs.
During testing, the platform detected changes in one dog’s eating patterns, which were eventually tied to a chipped tooth that was starting to become infected. In another case, the company’s app showed a sustained change from the dog’s regular eating and temperature baselines, which prompted the owner to take their dog to the vet and get a diagnosis for tick fever.
While this sounds useful, there are some caveats. The cohort for this beta was quite small, and the company seems to have shipped only about 50 devices so far. It currently offers the EverBowl and the app reports through $29-per-month subscription service.
Sharath also said the company does not yet have independent sensitivity, specificity, or false-positive rates for clinical events, as that would require a study comparing the system’s alerts against actual diagnoses. Hoomanely admits that its platform is not a replacement for a veterinary diagnosis, but is instead meant to help owners and vets to identify potential issues faster.
The company is using its data for formal veterinary studies to find out whether its system works across a larger group of dogs. “The veterinary studies being designed will measure sensitivity, specificity, positive predictive value and false positives for each alert category, and we intend to report results by use case rather than as one headline number.” Sharath said.
Along with those studies, Hoomanely plans to build more devices to gather data. EverSense is planned to be a wearable that will measure movement and rest information, and EverHub will be able to accept inputs from third-party devices such as smart collars, feeders, or home devices to record environmental data.
Sharath said the long-term plan for Hoomanely is to eventually become an animal health data company by using the data gathered from its devices to support research and serve nutrition and insurance companies. Because the data capture system isn’t specifically designed for dogs, she said it may eventually expand to other animals, such as cats, livestock, or horses.
The startup has raised $1.8 million in pre-seed funding so far and says it’s starting conversations for a seed round.
When you purchase through links in our articles, we may earn a small commission. This doesn’t affect our editorial independence.
>
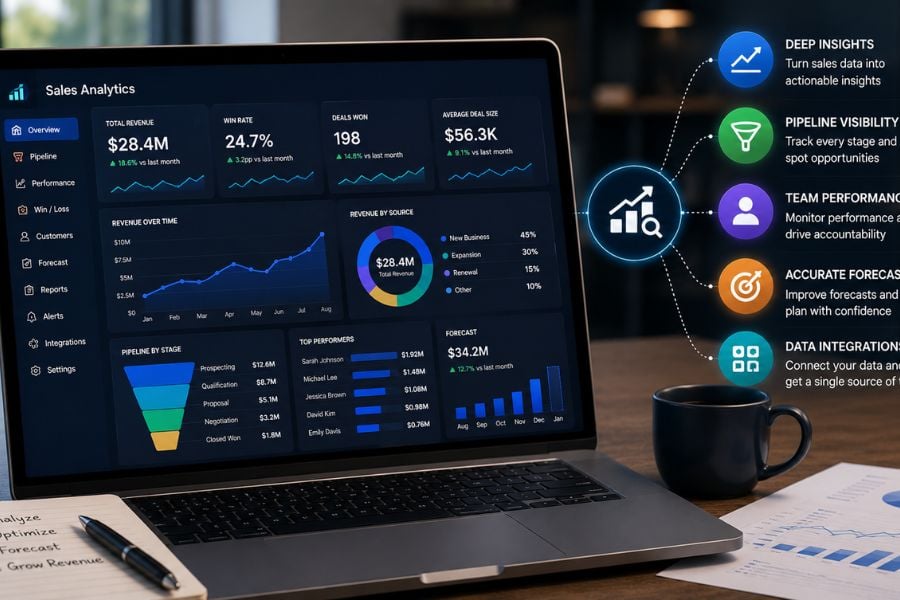
Sales teams rarely have a shortage of data. The harder problem is turning CRM records, pipeline activity, forecasts, buyer engagement, and rep performance into information revenue leaders can actually use.
The right sales analytics software can help RevOps and sales leaders identify pipeline bottlenecks, compare performance across teams and segments, monitor conversion, assess forecast risk, and determine where sellers should focus. The best choice depends on what needs analyzing: CRM performance, account and buyer signals, forecasts, customer conversations, or data spread across multiple business systems.
My picks for the top sales analytics tools include ZoomInfo for account intelligence and buyer signals, Salesforce for CRM-native analytics, Clari for forecasting and pipeline analysis, Gong for conversation-driven insights, and HubSpot CRM for growing teams.
ZoomInfo combines company and contact intelligence with enrichment and buyer signals to give revenue teams more context for account prioritization and sales analysis.
| ZoomInfo | ||
| Salesforce Analytics | ||
| Clari | ||
| Gong | ||
| HubSpot CRM | ||
| Salesloft |
Best sales analytics software at a glance
Why you can trust TechRepublic
|
To ensure we provide readers with the best answers, the TechRepublic editorial process adheres to strict standards, including rigorous research, assessment, and provider scoring. In this review, I evaluated the most important aspects of sales analytics software for revenue teams, including pipeline and forecasting capabilities, account and buyer intelligence, conversation analytics, integrations, ease of use, and pricing. My methodology also considered how well each platform supports distinct revenue use cases, along with product usability and feedback from real users. Furthermore, I leverage the following work experiences when carrying out software reviews:
|
 Bianca Caballero
Methodology: How I evaluated the best sales analytics tools
I compared these sales analytics tools based on the capabilities that matter most to sales leaders and RevOps teams, with an emphasis on how effectively each platform turns sales and revenue data into actionable insights.
- Pipeline and conversion analytics: How well the platform tracks pipeline value, movement, coverage, stage conversion, win rates, sales cycles, and potential bottlenecks.
- Sales performance analytics: The depth of reporting across reps, teams, territories, products, accounts, and customer segments.
- Forecasting and revenue visibility: The ability to monitor expected revenue, forecast changes, pipeline risk, deal progression, and performance trends.
- Account and buyer intelligence: The depth of company, contact, intent, engagement, and other buyer signals available for account analysis and prioritization.
- Data integration and enrichment: How easily the platform connects with CRM and other revenue systems, synchronizes relevant data, and enriches existing records where applicable.
- AI and automation: How effectively the platform uses AI and automation to surface patterns, risks, signals, summaries, or recommendations that reduce manual analysis.
- Customization and usability: How easily RevOps and sales leaders can configure reports, dashboards, metrics, and workflows, investigate performance changes, and get useful answers without excessive technical support.
I also evaluated each platform according to its strongest use case rather than assuming all six solve the same problem equally well. This approach helps buyers identify the platform that best addresses their revenue team’s priorities instead of looking for a single product that does everything equally well.
What makes ZoomInfo the best for account intelligence and sales prioritization?

Pros
- Strong B2B company and contact intelligence
- Useful intent and engagement signals for account prioritization
- CRM enrichment can improve segmentation and downstream reporting
Cons
- Pricing is not publicly listed
- Not a dedicated sales forecast-management platform
- May be more platform than smaller or lower-volume sales teams need
Why I chose ZoomInfo
ZoomInfo is strongest when the analytics problem starts with the quality of the underlying account and buyer data. Its combination of company and contact intelligence, CRM enrichment, intent signals, account segmentation, and conversation intelligence provides RevOps with more context to decide which accounts deserve attention and to analyze performance across meaningful customer segments.
The main trade-off is forecasting: ZoomInfo is not primarily designed as a forecast-management platform. For teams focused on account quality, buyer activity, segmentation, and prioritization, though, its intelligence layer can strengthen the data feeding CRM, analytics, prospecting, and sales workflows.
Also read: Revenue Intelligence Platforms: Key Features to Know
Key features
- Company and contact intelligence: ZoomInfo provides B2B company and professional data that helps teams research accounts, identify decision-makers, and add organizational context to CRM records.
- CRM data enrichment: Enrichment can fill missing account and contact fields and refresh existing records, improving the data used for routing, segmentation, and reporting.
- Buyer intent signals: Intent data helps surface accounts with increased research activity on relevant topics, giving sellers another signal to prioritize outreach.
- Account segmentation and prioritization: Firmographic, contact, and behavioral data can help RevOps organize accounts by ICP fit, territory, company attributes, or buying activity.
- Conversation intelligence: ZoomInfo’s broader platform includes conversation-intelligence capabilities that can provide additional context from sales calls and buyer interactions.
ZoomInfo pricing
ZoomInfo does not publish standard monthly or annual list prices. Contact ZoomInfo for a customized quote based on the included users, data allowances, add-on costs, and any usage-based fees.
What makes Salesforce Analytics the best for CRM-native sales analytics?
Pros
- Deep analytics tied directly to Salesforce CRM data
- Highly customizable dashboards and analytical models
- Strong forecasting and broader analytics ecosystem
Cons
- Advanced analytics can require additional licenses
- Configuration and administration can become complex
- Best value depends on an existing Salesforce ecosystem
Why I chose Salesforce Analytics
Salesforce Analytics makes the most sense for organizations that already treat Salesforce as the operational center of the sales process. Pipeline analysis, forecasting, configurable dashboards, CRM Analytics, and the broader Salesforce analytics ecosystem give mature teams substantial flexibility while keeping sales insights close to the underlying CRM records.
Complexity is the tradeoff. Advanced deployments can involve additional products, licensing, and administration. For organizations already deeply invested in Salesforce, however, keeping opportunity data, workflows, forecasting, and analytics within the same ecosystem can outweigh that overhead.
Key features
- CRM-native analytics: CRM Analytics works directly with Salesforce data, helping teams analyze sales performance without having to routinely export data to a separate system.
- Pipeline and opportunity analysis: Revenue teams can examine opportunity progression, pipeline changes, sales performance, and other CRM-based measures.
- Sales forecasting: Salesforce supports forecast management and expected-revenue analysis, with additional purpose-built revenue capabilities available through Revenue Intelligence.
- Custom dashboards and metrics: RevOps can create tailored dashboards, filters, models, and analytics applications around its sales processes and reporting requirements.
- AI-powered analytics: Higher-tier offerings add capabilities such as Einstein Discovery for predictions, automated data discovery, explanations, and scoring.
Salesforce Analytics pricing
- CRM Analytics Growth: $140/user/month
- CRM Analytics Plus: $165/user/month
- Revenue Intelligence: $220/user/month
- Industry Cloud Intelligence: $220/user/month
- Service Intelligence: $220/user/month
Free trial: 30 days
What makes Clari the best for forecasting and revenue predictability?

Pros
- Strong forecasting and pipeline-inspection capabilities
- Purpose-built for CRO and RevOps workflows
- Helps connect deal risk with forecast and pipeline reviews
Cons
- Pricing is not publicly listed
- May be excessive for teams with simple forecasting needs
- More specialized than general CRM reporting
Why I chose Clari
Clari excels when forecasting and pipeline inspection are formal operating disciplines rather than occasional reporting exercises. Its revenue forecasting, pipeline analytics, deal-risk capabilities, and trend visibility map closely to the questions leaders ask during forecast calls and pipeline reviews.
That specialization can be more than smaller teams need. For larger revenue organizations with structured forecasting processes, however, the narrow focus becomes an advantage because Clari is built around revenue predictability rather than generic dashboard creation.
Key features
- Revenue forecasting: Clari supports structured forecasting workflows that help sales leaders monitor expected results and forecast movement.
- Pipeline inspection: Teams can analyze pipeline coverage, changes, opportunity progression, and other signals that may affect future revenue.
- Deal risk analysis: Deal-level signals help managers identify opportunities that require closer inspection or intervention.
- Revenue trend reporting: RevOps can monitor patterns across forecast periods, pipeline movement, and historical performance.
- Revenue data integration: Clari brings information from CRM and other revenue systems into its forecasting and pipeline workflows.
Clari pricing
Clari uses custom pricing and does not publish standard monthly or annual per-user rates. Contact Clari to request a custom quote based on user count, modules, integrations, and deployment scope.
What makes Gong the best for conversation and deal analytics?

Pros
- Strong conversation intelligence capabilities
- Connects buyer engagement with deal and pipeline context
- Supports forecasting alongside conversation and deal analytics
Cons
- Pricing is quote-based
- Broader platform may be unnecessary for dashboard-only needs
- Value depends on consistently capturing buyer interactions
Why I chose Gong
Gong adds a layer of evidence that conventional CRM reporting often misses: what buyers and sellers are actually discussing and doing within an opportunity. Conversation intelligence, buyer engagement, deal analytics, forecasting, and coaching insights can help managers interpret whether a deal is genuinely progressing rather than relying only on manually maintained CRM fields.
The platform’s breadth can be unnecessary for teams that need only standard dashboards. When calls, meetings, stakeholder engagement, and rep behavior materially influence deal outcomes, though, Gong’s interaction data provides context that traditional sales reporting may not capture.
Also read: What Is Sales Intelligence? Tools, Benefits, and Use Cases
Key features
- Conversation intelligence: Gong captures and analyzes calls, meetings, emails, and other buyer interactions to surface patterns and important moments.
- Buyer engagement insights: Teams can examine stakeholder participation and engagement to understand whether opportunities have meaningful buyer involvement.
- Deal analytics: Gong combines CRM data and interaction signals to help managers evaluate opportunity health and progression.
- Sales forecasting: Forecast functionality supports revenue projections, pipeline review, and manager forecasting workflows.
- Coaching analytics: Conversation and activity data can help managers identify seller behaviors and coaching opportunities.
Gong pricing
Gong does not publish fixed monthly or annual list prices. Contact Gong to obtain a custom quote based on user licensing, included products, and implementation expenses.
What makes HubSpot CRM the best for growing revenue teams?
Pros
- CRM, sales execution, and reporting are closely integrated
- Lower starting price than many enterprise-focused platforms
- Monthly and annual billing are available on key tiers
Cons
- More advanced analytics require higher tiers
- Professional and Enterprise carry onboarding fees
- Less flexible than dedicated BI software for complex modeling
Why I chose HubSpot CRM
HubSpot CRM strikes a useful balance between capability and accessibility. Pipeline reporting, activity analytics, forecasting, conversation intelligence, and CRM workflows give growing teams a path beyond spreadsheets without immediately requiring a separate analytics stack.
The limitation is that the strongest reporting and analytics features become increasingly tied to higher subscription tiers. Even so, the integrated CRM experience and comparatively lighter administration can make that tradeoff worthwhile for teams prioritizing adoption and speed.
Key features
- Pipeline reporting: HubSpot CRM provides pipeline and deal reporting that helps teams monitor opportunity stages and sales performance.
- Sales activity analytics: Managers can analyze emails, calls, meetings, tasks, and other activity alongside deal results.
- Forecasting: Professional and Enterprise support more advanced forecasting and team-level revenue visibility.
- Conversation intelligence: Enterprise includes conversation intelligence capabilities for recording, transcription, and coaching insights.
- Sales automation and reporting: Higher tiers add customizable workflows and deeper reporting for more complex sales processes.
HubSpot CRM pricing
What makes Salesloft best for sales engagement and revenue execution analytics?

Pros
- Connects analytics directly with seller workflows
- Combines engagement, conversation, and deal insights
- Includes reporting and AI-powered workflow capabilities
Cons
- Pricing is not publicly listed
- Broad platform can be excessive for teams with simple reporting needs
- Less suited to standalone BI and highly customized analytics
Why I chose Salesloft
Salesloft is most compelling when analytics need to drive direct seller action. Its engagement workflows, conversation intelligence, deal management, analytics, and CRM synchronization make it particularly useful for teams that want reps and managers to act on insights inside their day-to-day sales process.
The downside is breadth: organizations that only need lightweight reporting may not need a full sales execution platform. For teams already investing heavily in structured sales engagement, however, bringing analytics and execution together can reduce the need to move between disconnected tools.
Key features
- Conversation intelligence: Salesloft can capture and analyze customer conversations to give reps and managers more context around interactions and deals.
- Deal management: Deal-focused workflows help teams inspect opportunities, identify risks, and determine appropriate next actions.
- Reporting and analytics: Salesloft includes reporting capabilities for monitoring seller activity, engagement, and performance across sales workflows.
- AI-powered workflows: AI can help guide seller actions and reduce manual work by using signals and workflow context.
- CRM synchronization: Bi-directional CRM sync helps keep engagement and sales data connected with the organization’s system of record. Salesloft lists reporting and analytics, AI-powered workflows, coaching, and bi-directional CRM sync among its platform capabilities.
Salesloft pricing
Salesloft does not publish monthly or annual list prices. Contact Salesloft to request a custom quote based on included platform capabilities, number of user licenses, implementation services, and add-ons.
Sales analytics software vs revenue intelligence software
Sales analytics software primarily helps teams measure and analyze sales performance. Revenue intelligence platforms typically go further by combining pipeline information with buyer activity, forecasting, and risk or opportunity signals.
| Primary purpose | Measure sales performance | Improve revenue execution |
| Typical outputs | KPIs, dashboards, trends, conversion analysis | Forecasts, deal risk, buyer signals, recommended actions |
| Common inputs | CRM, pipeline, sales activity | CRM plus calls, emails, meetings, and engagement data |
| Core question | What happened and where? | What is likely to happen and what needs attention? |
| Typical users | RevOps, sales leaders, analysts | RevOps, CROs, managers, sellers |
The categories increasingly overlap. Salesforce provides analytics and revenue intelligence capabilities, while Clari and Gong combine analytics with forecasting and execution workflows. Buyers should focus on the capabilities their teams need rather than the category label alone.
What features matter most in sales analytics tools?
The strongest sales analytics tools do more than create dashboards. They let revenue teams move from a high-level performance change to the accounts, opportunities, activities, or segments behind it.
CRM and data integration
Determine which systems the platform connects to and what data actually moves between them.
Verify supported CRM objects, custom fields, historical data, sync frequency, and external data sources. A long integration list has limited value if the fields required for your reports cannot be synchronized.
Pipeline and conversion analytics
Look for the ability to analyze pipeline coverage, stage conversion, win/loss performance, sales cycle length, deal slippage, and pipeline trends.
Managers should be able to move from a company-wide change to the team, segment, rep, or individual opportunities responsible for it.
Forecasting and trend analysis
If forecasting matters, determine whether the software merely displays current pipeline or helps explain changes in expected revenue.
Look for historical comparisons, pipeline movement, forecast categories, risk indicators, and drill-down capabilities appropriate to your sales process.
Custom dashboards and metrics
Your reporting model should match your sales motion.
Check whether RevOps can define custom metrics, filters, segments, and dashboards without repeatedly depending on engineering or vendor support.
Segmentation
Useful sales analysis should allow teams to compare performance by dimensions such as rep, team, territory, product, customer segment, source, and deal size.
This is also where account data quality matters. Incomplete company and contact records can limit the usefulness of otherwise sophisticated reporting.
AI-assisted insights
AI should reduce analytical work rather than simply add a summary box to an existing dashboard.
Ask vendors to demonstrate how AI identifies anomalies, surfaces risk, explains changes, prioritizes accounts, or recommends what a manager should investigate.
Governance and metric consistency
Analytics become less useful when different teams create competing definitions of the same KPI.
Look for permissions, standardized metrics, controlled dashboard access, and sufficient transparency so users can understand where reported numbers originate.
How to choose the best sales analytics software
The best sales analytics software is the product that answers your team’s most important revenue questions without creating unnecessary data or administrative complexity.
- List the questions your current reporting cannot answer.
Document the decisions that are difficult to make today before evaluating software.
Example: If managers can see total pipeline but cannot identify why stage conversion is falling, prioritize tools with conversion and pipeline diagnostics instead of simply adding more dashboard templates.
- Decide whether you need CRM-native or cross-system analytics.
CRM-native analytics may be simpler when most relevant sales data already lives in one system. Broader analytics platforms become more valuable when RevOps needs to combine CRM data with finance, marketing, product, or other sources.
Example: A Salesforce-centric organization may be able to answer most operational questions with native analytics, while a RevOps team combining CRM, billing, profitability, and product usage data may need a broader BI layer.
- Test the platform with your own sales data.
Vendor demo environments are designed to look clean. Your production data may not.
Example: Ask each vendor to reproduce your current win rate, pipeline, sales cycle, and forecast reports using representative records. Compare the results with your existing numbers and investigate discrepancies.
- Check metric flexibility.
Determine whether RevOps can adapt calculations to your organization’s definitions.
Example: If your company calculates pipeline coverage differently for enterprise and SMB teams, verify whether the platform supports both definitions without exporting data to a spreadsheet.
- Evaluate drill-down capabilities.
A dashboard should help explain changes, not merely report them.
Example: When win rate falls, test whether a manager can move from the company-wide KPI to segment, territory, rep, stage, and individual opportunity data without building a new report.
- Measure administrative overhead.
Consider what happens after implementation.
Example: Ask who needs to modify a dashboard when the sales organization adds a segment or changes opportunity stages. If every adjustment requires technical resources, include that dependency in the buying decision.
- Compare the total analytics stack.
Do not evaluate a platform in isolation.
Example: Map the analytics products you already pay for against the proposed platform. Identify which functions it replaces, which it complements, and where reporting would remain duplicated.
Common sales analytics software buying mistakes
Revenue teams can add sophisticated analytics without improving decision-making if they choose software before defining how it will be used.
- Buying dashboards instead of answers: More visualizations do not necessarily help teams diagnose performance or make better decisions.
- Ignoring CRM data quality: Analytics cannot fully compensate for inconsistent stages, missing fields, duplicate accounts, or stale close dates.
- Choosing based on vendor demos: Test products against real sales questions and representative company data.
- Overlooking adoption: Managers and reps need to understand and trust the metrics if analytics are going to influence behavior.
- Creating duplicate reporting layers: Another analytics platform can worsen metric inconsistency when data ownership and KPI definitions are unclear.
- Ignoring administration costs: Licensing is only part of the investment. Factor in implementation, integrations, data modeling, governance, training, and dashboard maintenance.
>
Well, the day many Apple users have dreaded has come. Apple Maps is no longer entirely ad-free.
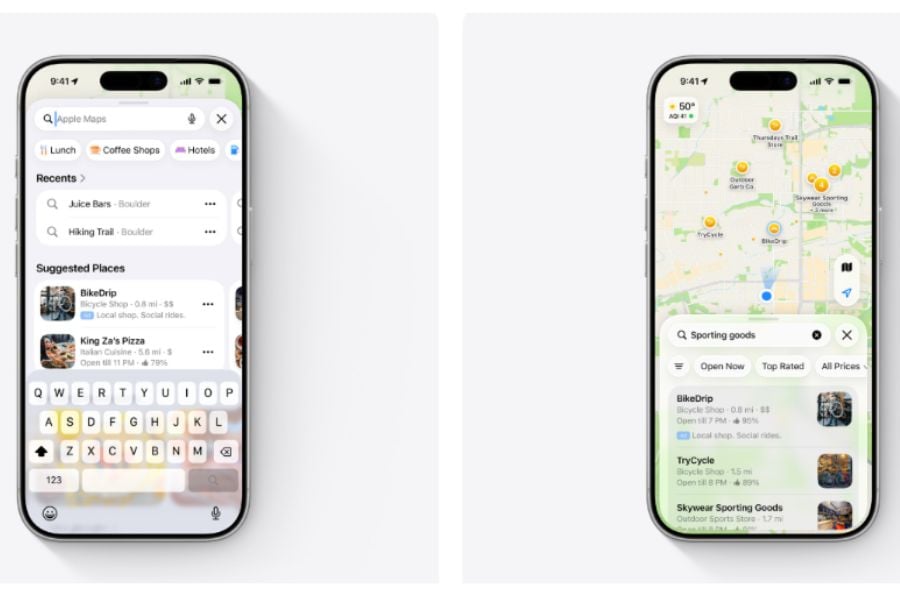
Apple has begun rolling out sponsored business listings to Maps users in the U.S. and Canada, following plans announced earlier this year to expand its advertising business. Ads can appear before a search and at the top of relevant search results, with a broader rollout expected over the coming weeks.
For iPhone users, the biggest change is simple: sponsored listings are now part of the Maps experience, and there is currently no option to pay to remove them — even for iCloud+ or Apple One subscribers.
Where Apple Maps ads will appear
Fortunately, Apple isn’t flooding Maps with ads everywhere. Instead, the ads can appear in two places within the Maps app.
Before users search, an initial advertisement can appear in the “Suggested Places” section of the search screen. After a user enters a search, a second ad can also appear at the top of relevant search results.
Users will see at most one ad per location, according to 9to5mac. Paid listings are designed to look similar to other business results but carry a blue “Ad” label to distinguish them from organic listings. So while the ads may look similar to regular business listings, watchful users should be able to tell when a business has paid for placement.
Google Maps has offered promoted business listings for years. For Apple Maps users, however, the rollout removes one distinction between the two services: Apple Maps had previously offered an ad-free search experience.
Apple emphasizes privacy
This represents another step Apple is taking to expand advertising beyond traditional placements in services such as the App Store. The company has framed advertising as a business opportunity while attempting to differentiate its approach from competitors by emphasizing privacy.
Naturally, introducing advertising in a mapping app is going to raise some important privacy questions. After all, Maps has access to information about what users search for and where they are while using the app.
Fortunately, the company says Maps advertising will not associate a user’s location or the ads they see and interact with their Apple Account. Apple also says personal data stays on the user’s device and isn’t collected or stored by Apple or shared with third parties.
Users may still see ads based on their approximate location, current search terms, or the part of the map they’re viewing. But Apple says that this advertising information isn’t linked to users’ Apple Accounts.
Some Apple Maps users are unhappy
Of course, the ads have already attracted some criticism from Apple Maps users.
Initial reactions reported online have included complaints that advertising makes Maps less appealing and comparisons with Google Maps, particularly among users who previously preferred Apple Maps for its ad-free design.
Some responses have even included users saying they will switch to Google Maps, while others have questioned why they should continue using Apple Maps now that it has ads.
Another important thing: unlike some paid digital services, users cannot currently pay to remove the Maps advertisements. That means even users who pay for services such as iCloud+ or Apple One can’t remove the sponsored listings, either.
Now, does this really mean that Apple Maps is about to lose a huge number of users? Well, the impact on the app remains unclear. While some users might consider switching, ads alone are unlikely to determine everyone’s choice. Furthermore, Apple Maps is also deeply integrated into the iPhone and Apple’s broader ecosystem, which could make a wholesale switch less likely.
Still, the move for Apple is a risk. Ads might generate another stream of revenue for the company, but they also significantly change an experience that many users had come to expect.
What the ads mean for businesses
On the flip side, the rollout creates an immediate new advertising channel for businesses. For them, Maps ads could be a useful new way to reach potential customers.
A restaurant, retailer, or other local business can pay for a prominent position when people are looking for places to visit. Appearing near the top of a Maps search could allow advertisers to reach potential customers when they are actively looking for a particular type of business.
Apple has already opened Maps ad booking and is offering a promotional deal for businesses interested in trying the new placements, helping them compete for attention at the top of local search results.
Must-read Apple coverage
Apple’s growing advertising business
As the rollout continues, it points to Apple’s broader push to integrate advertising across its ecosystem. The company already sells ads across various parts of its business, including the App Store. Maps gives it another place to generate advertising revenue.
It will be interesting to see whether Maps advertising will remain relatively limited or eventually become a much larger part of the experience, and how this will impact customer response.
For now, the rollout remains relatively limited: sponsored listings are clearly labeled and appear only in specific parts of Maps. The bigger question is whether Apple keeps that footprint small as its advertising business expands — or whether ads gradually become a more visible part of using an iPhone.
Other News: Google has introduced pay-as-you-go pricing, spending caps, and savings plans for Gemini Enterprise to help businesses better control the unpredictable costs of AI agents.
>

England v Pakistan Second Test: Khurram Shahzad makes an incredible diving catch to remove Jordan Cox

Hoomanely’s building a smart feeding bowl and an AI platform to help owners spot when their pup is sick

Karoline Leavitt Debriefs Her Last Day as Trump’s Press Secretary
-

 movies3 months ago
Search For Canadian TV Actor Stewart McLean Now Homicide Investigation
-

 Fashion9 years ago
These ’90s fashion trends are making a comeback in 2017
-
Fashion9 years ago
According to Dior Couture, this taboo fashion accessory is back
-
Fashion9 years ago
Model Jocelyn Chew’s Instagram is the best vacation you’ve ever had
-
Fashion9 years ago
Emily Ratajkowski channels back-to-school style
-
Fashion9 years ago
9 Celebrities who have spoken out about being photoshopped
-
Fashion9 years ago
Your comprehensive guide to this fall’s biggest trends
-

 Anime3 months ago
Rurouni Kenshin: Hokkaido Arc Manga Takes 1-Issue Break – News